plotGmmThreshold - Plot findThreshold results for the gmm method
Description
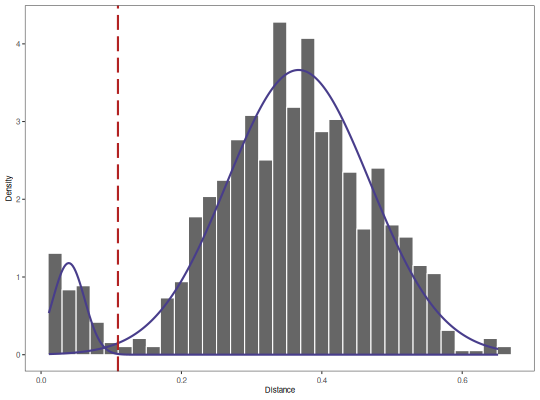
plotGmmThreshold plots the results from "gmm" method of
findThreshold, including the Gaussian distributions, input nearest neighbor
distance histogram, and threshold selected.
Usage
plotGmmThreshold(
data,
cross = NULL,
xmin = NULL,
xmax = NULL,
breaks = NULL,
binwidth = NULL,
title = NULL,
size = 1,
silent = FALSE,
...
)
Arguments
- data
- GmmThreshold object output by the
"gmm"method of findThreshold. - cross
- numeric vector of distances from distToNearest to draw as a
histogram below the
datahistogram for comparison purposes. - xmin
- minimum limit for plotting the x-axis. If
NULLthe limit will be set automatically. - xmax
- maximum limit for plotting the x-axis. If
NULLthe limit will be set automatically. - breaks
- number of breaks to show on the x-axis. If
NULLthe breaks will be set automatically. - binwidth
- binwidth for the histogram. If
NULLthe binwidth will be set automatically. - title
- string defining the plot title.
- size
- numeric value for lines in the plot.
- silent
- if
TRUEdo not draw the plot and just return the ggplot2 object; ifFALSEdraw the plot. - …
- additional arguments to pass to ggplot2::theme.
Value
A ggplot object defining the plot.
Examples
# Subset example data to one sample as a demo
data(ExampleDb, package="alakazam")
db <- subset(ExampleDb, sample_id == "-1h")

# Use nucleotide Hamming distance and normalize by junction length
db <- distToNearest(db, sequenceColumn="junction", vCallColumn="v_call_genotyped",
jCallColumn="j_call", model="ham", normalize="len", nproc=1)

# To find the threshold cut, call findThreshold function for "gmm" method.
output <- findThreshold(db$dist_nearest, method="gmm", model="norm-norm", cutoff="opt")
print(output)
[1] 0.1095496
# Plot results
plotGmmThreshold(output, binwidth=0.02)
See also
See GmmThreshold for the the input object definition and findThreshold for generating the input object. See distToNearest calculating nearest neighbor distances.