plotMutability - Plot mutability probabilities
Description
plotMutability plots the mutability rates of a TargetingModel.
Usage
plotMutability(
model,
nucleotides = c("A", "C", "G", "T"),
mark = NULL,
style = c("hedgehog", "bar"),
size = 1,
silent = FALSE,
...
)
Arguments
- model
- TargetingModel object or vector containing normalized mutability rates.
- nucleotides
- vector of center nucleotide characters to plot.
- mark
- vector of 5-mer motifs to highlight in the plot. If
NULLonly highlight classical hot and cold spot motifs. - style
- type of plot to draw. One of:
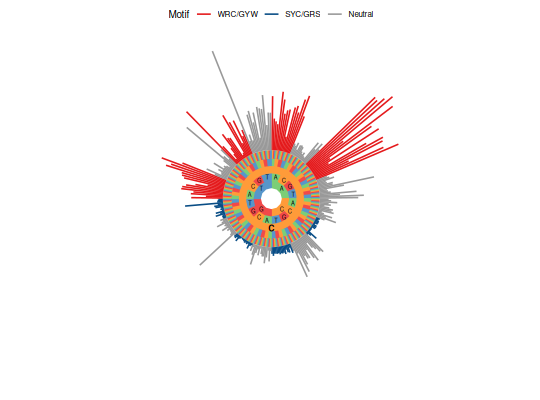
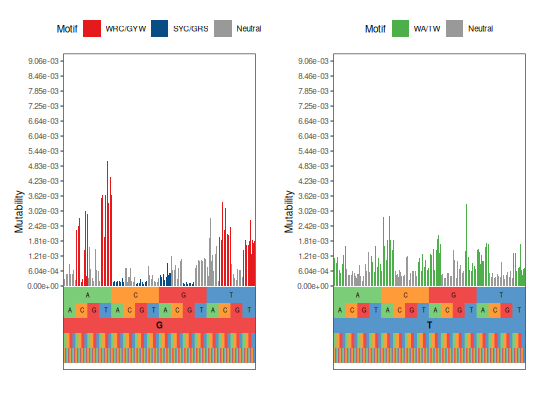
"hedgehog": circular plot showing higher mutability scores further from the circle. The 5-mer is denoted by the values of the inner circle. The 5-mer is read from the most interior position of the 5-mer (5’) to most exterior position (3’), with the center nucleotide in the center ring. Note, the order in which the 5-mers are plotted is different for nucleotidesc("A", "C")andc("G", "T")."bar": bar plot of mutability similar to thehedgehogstyle with the most 5’ positions of each 5-mer at the base of the plot.
- size
- numeric scaling factor for lines and text in the plot.
- silent
- if
TRUEdo not draw the plot and just return the ggplot2 objects; ifFALSEdraw the plot. - …
- additional arguments to pass to ggplot2::theme.
Value
A named list of ggplot objects defining the plots, with names defined by the center nucleotide for the plot object.
Examples
# Plot one nucleotide in circular style
plotMutability(HH_S5F, "C")
# Plot two nucleotides in barchart style
plotMutability(HH_S5F, c("G", "T"), style="bar")
See also
Takes as input a TargetingModel object. See createTargetingModel for model building.