plotTune - Visualize parameter tuning for minNumMutations and minNumSeqMutations
Description
Visualize results from minNumMutationsTune and minNumSeqMutationsTune
Usage
plotTune(
tuneMtx,
thresh,
criterion = c("5mer", "3mer", "1mer", "3mer+1mer", "measured", "inferred"),
pchs = 1,
ltys = 2,
cols = 1,
plotLegend = TRUE,
legendPos = "topright",
legendHoriz = FALSE,
legendCex = 1
)
Arguments
- tuneMtx
- a
matrixor alistof matrices produced by either minNumMutationsTune or minNumSeqMutationsTune. In the case of a list, it is assumed that each matrix corresponds to a sample and that all matrices in the list were produced using the same set of trial values ofminNumMutationsorminNumSeqMutations. - thresh
- a number or a vector of indicating the value or the range of values
of
minNumMutationsorminNumSeqMutationsto plot. Should correspond to the columns oftuneMtx. - criterion
- one of
"5mer","3mer","1mer", or"3mer+1mer"(fortuneMtxproduced by minNumMutationsTune), or either"measured"or"inferred"(fortuneMtxproduced by minNumSeqMutationsTune). - pchs
- point types to pass on to plot.
- ltys
- line types to pass on to plot.
- cols
- colors to pass on to plot.
- plotLegend
- whether to plot legend. Default is
TRUE. Only applicable iftuneMtxis a named list with names of the matrices corresponding to the names of the samples. - legendPos
- position of legend to pass on to legend. Can be either a
numeric vector specifying x-y coordinates, or one of
"topright","center", etc. Default is"topright". - legendHoriz
- whether to make legend horizontal. Default is
FALSE. - legendCex
- numeric values by which legend should be magnified relative to 1.
Details
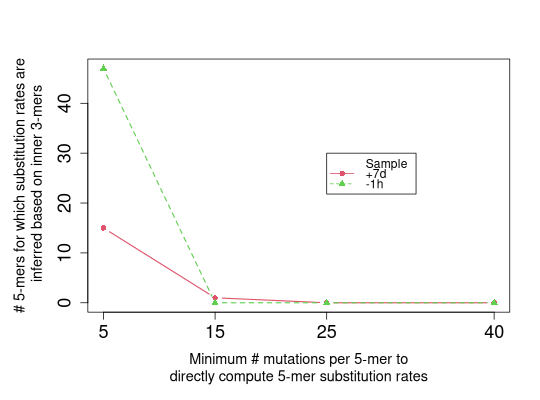
For tuneMtx produced by minNumMutationsTune, for each sample, depending on
criterion, the numbers of 5-mers for which substitution rates are directly computed
("5mer"), inferred based on inner 3-mers ("3mer"), inferred based on
central 1-mers ("1mer"), or inferred based on inner 3-mers and central 1-mers
("3mer+1mer") are plotted on the y-axis against values of minNumMutations
on the x-axis.
For tuneMtx produced by minNumSeqMutationsTune, for each sample, depending on
criterion, the numbers of 5-mers for which mutability rates are directly measured
("measured") or inferred ("inferred") are plotted on the y-axis against values
of minNumSeqMutations on the x-axis.
Note that legends will be plotted only if tuneMtx is a supplied as a named list
of matrices, ideally with names of each matrix corresponding to those of the samples
based on which the matrices were produced, even if plotLegend=TRUE.
Examples
# Subset example data to one isotype and 200 sequences
data(ExampleDb, package="alakazam")
db <- subset(ExampleDb, c_call == "IGHA")
set.seed(112)
db <- dplyr::slice_sample(db, n=50)

tuneMtx = list()
for (i in 1:length(unique(db$sample_id))) {
# Get data corresponding to current sample
curDb = db[db[["sample_id"]] == unique(db[["sample_id"]])[i], ]

# Count the number of mutations per 5-mer
subCount = createSubstitutionMatrix(db=curDb, model="s",
sequenceColumn="sequence_alignment",
germlineColumn="germline_alignment_d_mask",
vCallColumn="v_call",
multipleMutation="independent",
returnModel="5mer", numMutationsOnly=TRUE)

# Tune over minNumMutations = 5..50
subTune = minNumMutationsTune(subCount, seq(from=5, to=50, by=5))

tuneMtx = c(tuneMtx, list(subTune))
}

# Name tuneMtx after sample names
names(tuneMtx) = unique(db[["sample_id"]])

# plot with legend for both samples for a subset of minNumMutations values
plotTune(tuneMtx, thresh=c(5, 15, 25, 40), criterion="3mer",
pchs=16:17, ltys=1:2, cols=2:3,
plotLegend=TRUE, legendPos=c(25, 30))
# plot for only 1 sample for all the minNumMutations values (no legend)
plotTune(tuneMtx[[1]], thresh=seq(from=5, to=50, by=5), criterion="3mer")

See also
See minNumMutationsTune and minNumSeqMutationsTune for generating
tuneMtx.