testBaseline - Two-sided test of BASELINe PDFs
Description
testBaseline performs a two-sample significance test of BASELINe
posterior probability density functions (PDFs).
Usage
testBaseline(baseline, groupBy)
Arguments
- baseline
Baselineobject containing thedband grouped BASELINe PDFs returned by groupBaseline.- groupBy
- string defining the column in the
dbslot of theBaselinecontaining sequence or group identifiers.
Value
A data.frame with test results containing the following columns:
region: sequence region, such ascdrandfwr.test: string defining the groups be compared. The string is formatted as the conclusion associated with the p-value in the formGROUP1 != GROUP2. Meaning, the p-value for rejection of the null hypothesis that GROUP1 and GROUP2 have equivalent distributions.pvalue: two-sided p-value for the comparison.fdr: FDR correctedpvalue.
References
- Yaari G, et al. Quantifying selection in high-throughput immunoglobulin sequencing data sets. Nucleic Acids Res. 2012 40(17):e134. (Corrections at http://selection.med.yale.edu/baseline/correction/)
Examples
# Subset example data as a demo
data(ExampleDb, package="alakazam")
db <- subset(ExampleDb, c_call %in% c("IGHM", "IGHG"))
set.seed(112)
db <- dplyr::slice_sample(db, n=200)

# Collapse clones
db <- collapseClones(db, cloneColumn="clone_id",
sequenceColumn="sequence_alignment",
germlineColumn="germline_alignment_d_mask",
method="thresholdedFreq", minimumFrequency=0.6,
includeAmbiguous=FALSE, breakTiesStochastic=FALSE)

# Calculate BASELINe
baseline <- calcBaseline(db,
sequenceColumn="clonal_sequence",
germlineColumn="clonal_germline",
testStatistic="focused",
regionDefinition=IMGT_V,
targetingModel=HH_S5F,
nproc=1)
calcBaseline will calculate observed and expected mutations for clonal_sequence using clonal_germline as a reference.
Calculating BASELINe probability density functions...
# Group PDFs by the isotype
grouped <- groupBaseline(baseline, groupBy="c_call")
Grouping BASELINe probability density functions...
Calculating BASELINe statistics...
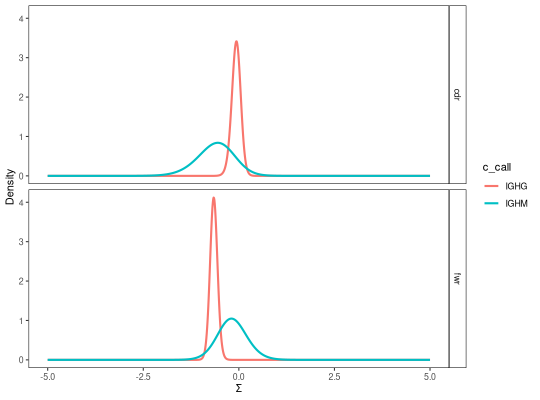
# Visualize isotype PDFs
plot(grouped, "c_call")
# Perform test on isotype PDFs
testBaseline(grouped, groupBy="c_call")
  region         test    pvalue       fdr
1    cdr IGHM != IGHG 0.1353078 0.1353078
2    fwr IGHM != IGHG 0.1112142 0.1353078
See also
To generate the Baseline input object see groupBaseline.