plotBaselineSummary - Plots BASELINe summary statistics
Description
plotBaselineSummary plots a summary of the results of selection analysis
using the BASELINe method.
Usage
plotBaselineSummary(
baseline,
idColumn,
groupColumn = NULL,
groupColors = NULL,
subsetRegions = NULL,
facetBy = c("region", "group"),
title = NULL,
style = c("summary"),
size = 1,
silent = FALSE,
...
)
Arguments
- baseline
- either a data.frame returned from summarizeBaseline
or a
Baselineobject returned from groupBaseline containing selection probability density functions and summary statistics. - idColumn
- name of the column in
baselinecontaining primary identifiers. If the input is aBaselineobject, then this will be a column in thestatsslot ofbaseline. - groupColumn
- name of the column in
baselinecontaining secondary grouping identifiers. If the input is aBaselineobject, then this will be a column in thestatsslot ofbaseline. - groupColors
- named vector of colors for entries in
groupColumn, with names defining unique values in thegroupColumnand values being colors. Also controls the order in which groups appear on the plot. IfNULLalphabetical ordering and a default color palette will be used. Has no effect iffacetBy="group". - subsetRegions
- character vector defining a subset of regions to plot, correspoding
to the regions for which the
baselinedata was calculated. IfNULLall regions inbaselineare plotted. - facetBy
- one of c(“group”, “region”) specifying which category to facet the
plot by, either values in
groupColumn(“group”) or regions defined inbaseline(“region”). The data that is not used for faceting will be color coded. - title
- string defining the plot title.
- style
- type of plot to draw. One of:
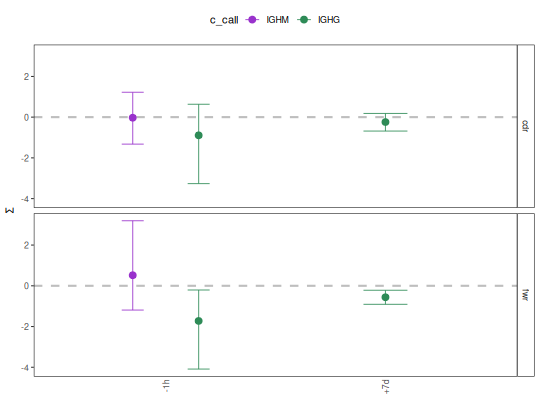
"summary": plots the mean and confidence interval for the selection scores of each value inidColumn. Faceting and coloring are determine by values ingroupColumnand regions defined inbaseline, depending upon thefacetByargument.
- size
- numeric scaling factor for lines, points and text in the plot.
- silent
- if
TRUEdo not draw the plot and just return the ggplot2 object; ifFALSEdraw the plot. - …
- additional arguments to pass to ggplot2::theme.
Value
A ggplot object defining the plot.
Examples
# Subset example data as a demo
data(ExampleDb, package="alakazam")
db <- subset(ExampleDb, c_call %in% c("IGHM", "IGHG"))
set.seed(112)
db <- dplyr::slice_sample(db, n=25)

# Collapse clones
db <- collapseClones(db, cloneColumn="clone_id",
sequenceColumn="sequence_alignment",
germlineColumn="germline_alignment_d_mask",
method="thresholdedFreq", minimumFrequency=0.6,
includeAmbiguous=FALSE, breakTiesStochastic=FALSE)

# Calculate BASELINe
baseline <- calcBaseline(db,
sequenceColumn="clonal_sequence",
germlineColumn="clonal_germline",
testStatistic="focused",
regionDefinition=IMGT_V,
targetingModel=HH_S5F,
nproc=1)
calcBaseline will calculate observed and expected mutations for clonal_sequence using clonal_germline as a reference.
Calculating BASELINe probability density functions...
# Grouping the PDFs by sample and isotype annotations
grouped <- groupBaseline(baseline, groupBy=c("sample_id", "c_call"))
Grouping BASELINe probability density functions...
Calculating BASELINe statistics...
# Plot mean and confidence interval by region with custom group colors
isotype_colors <- c("IGHM"="darkorchid", "IGHD"="firebrick",
"IGHG"="seagreen", "IGHA"="steelblue")
plotBaselineSummary(grouped, "sample_id", "c_call",
groupColors=isotype_colors, facetBy="region")
See also
Takes as input either a Baseline object returned by groupBaseline or a data.frame returned from summarizeBaseline.